The process for my annual preview series is pretty straightforward: set some early projections in February (check), embark on a conference-by-conference preview series (check), then update the projections in August to account for roster movement. With the preview series officially in the books, it’s time for step three.
SP+ is my opponent- and tempo-adjusted look at the most sustainable and predictive aspects of college football. It is intended to be predictive and forward-facing; it is a power ranking, not a résumé ranking that gives credit for big wins or brave scheduling. You can find the final 2020 rankings here. SP+ projections, meanwhile, consist primarily of three pieces:
1. Returning production. As I wrote last week, I have updated rosters as much as possible to account for transfers, graduation and the announced return of many 2020 seniors. The combination of last year’s SP+ ratings and adjustments based on returning production generally makes up more than two-thirds of the projections formula.
Since February, however, I’ve made one noteworthy, and hopefully temporary, change to how returning production is weighted. The more I thought about it, the less I was able to reconcile the idea of valuing returning production equally among teams that played a pretty full schedule last season and teams that, like an Ohio or Arizona State, played only three or four games. So I set up a sliding scale: If you played 10-plus games, returning production adjustments count as they would under normal circumstances, but if you played less than that, those effects were diminished, and the projection factors below were factored a bit more heavily.
2. Recent recruiting. Returning production aims to tell us what kind of talent and experience a team is returning. Recruiting rankings inform us of the caliber of the team’s potential replacements in the lineup. They generally make up about one-quarter of the projections formula. This piece is determined not only by the most recent recruiting class but also, in diminishing fashion, by the past three classes.
3. Recent history. The previous year’s ratings are a huge piece of the puzzle, but using a sliver of information from previous seasons (two to four years ago) gives us a good measure of overall program health. It stands to reason that a team that has played well for one year is less likely to duplicate that effort than a team that has been good for years on end (and vice versa), right? This is a minor piece of the puzzle, but the projections are better with it than without.
Most teams’ ratings are similar to what was found in the February projections, but a few ratings ended up changing for any number of reasons. It might have been for teams that, as mentioned above, played a tiny number of games. It might have been for teams that suffered a key long-term injury or lost noteworthy players to transfer. Or perhaps I just couldn’t find complete information for which “super seniors” were and weren’t returning for a given team before we published the initial projections.
Regardless, I’ve scrubbed all team rosters for changes, and while there will likely be more injuries and transfers in the weeks to come, these numbers are as up to date as they can be.
So let’s get to it. Here are the updated 2021 SP+ projections as of Aug. 12. Projected win totals will be posted in the coming weeks.
SP+ by conference
Here are the projected top four teams for each FBS conference (and independents):
-
AAC: No. 19 Cincinnati, No. 34 UCF, No. 47 Memphis, No. 55 Tulane
-
ACC: No. 2 Clemson, No. 8 Miami, No. 11 UNC, No. 33 Virginia Tech
-
Big 12: No. 3 Oklahoma, No. 7 Iowa State, No. 20 Texas, No. 27 Oklahoma State
-
Big Ten: No. 4 Ohio State, No. 6 Wisconsin, No. 10 Penn State, No. 16 Iowa
-
Conference USA: No. 68 UAB, No. 75 FAU, No. 80 Marshall, No. 91 UTSA
-
Indies: No. 18 Notre Dame, No. 31 BYU, No. 54 Liberty, No. 87 Army
-
MAC: No. 66 Toledo, No. 72 WMU, No. 85 Ohio, No. 86 Ball State
-
Mountain West: No. 39 Boise State, No. 67 Nevada, No. 73 SDSU, No. 77 Wyoming
-
Pac-12: No. 13 Washington, No. 14 USC, No. 15 Oregon, No. 21 Utah
-
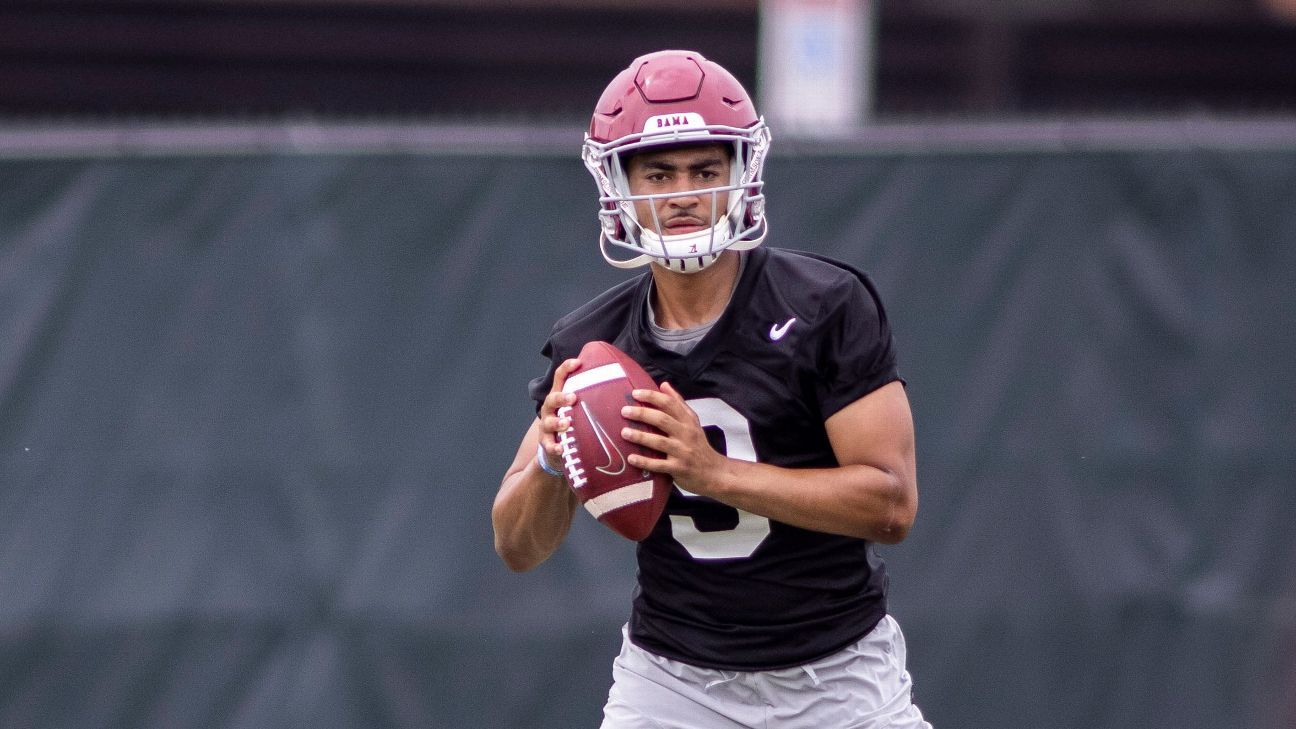
SEC: No. 1 Alabama, No. 5 Georgia, No. 9 Texas A&M, No. 12 Florida
-
Sun Belt: No. 30 Louisiana, No. 36 Appalachian State, No. 37 Coastal Carolina, No. 65 Troy
Meanwhile, here are the average SP+ rankings by conference:
-
Big Ten: 12.2
-
SEC: 12.1
-
Big 12: 10.1
-
Pac-12: 10.0
-
ACC: 8.3
-
AAC: 2.5
-
Sun Belt: -1.4
-
Mountain West: -3.2
-
MAC: -5.8
-
Conference USA: -8.5
The Big Ten ekes out the advantage over the SEC, in part because of how little SP+ thinks of the SEC East. Georgia and Florida are each in the top 12 overall, but no other East team ranks in the top 40, and two rank outside of the top 80. The Big Ten’s bottom teams grade out just better enough to give it the edge. (The SEC still has Bama, though. That’s an edge, too.)
Notice the conferences ranked fourth and fifth, by the way. We treat the Pac-12 as if it’s by far the worst power conference, but it has been better than the ACC for a number of years and could be again this fall. The difference, of course: The Pac-12 might have a ton of potential top-20 teams, but it doesn’t have a Clemson.
Updated returning production rankings
As mentioned at the top, I tinkered with the value of returning production in this year’s projections based on how much of a season a team actually got in last fall. But it’s still interesting and instructive to look at the overall returning production list. (For more on how returning production is calculated, go here.)
(Note: NMSU is not listed here. The Aggies played two games against FCS teams this spring, and I didn’t feel comfortable basing figures on only that. Rest assured, though: However you choose to estimate it, almost no regulars from their 2019 season return.)
From 2014 to ’20, the national average for returning production was 62.6%. Thanks to the extra year of eligibility granted to all athletes during the pandemic season, just about everyone (Northwestern aside) returns a healthy percentage of last year’s production. That could mean outstanding things for the overall quality of play in college football in 2021. Granted, someone will still have to lose every game, of course.
Average returning production by conference:
-
MAC 83.1%
-
Mountain West 82.0%
-
Sun Belt 81.6%
-
Pac-12 79.5%
-
Conference USA 76.6%
-
ACC 75.1%
-
Big Ten 75.1%
-
AAC 74.6%
-
Big 12 73.2%
-
SEC 68.1%
You could draw a decent correlation between the number of games each conference played on average and the amount of returning production. Those that played mostly full seasons are mostly at the bottom of the list (Sun Belt aside), while those that only got in about a half-season are at the top. It stands to reason, right? If you didn’t get much of a senior season, you might be a little hungrier to use the super-senior option.